
Here’s my entry for the SAP Ultimate Data Geek Challenge, a contest designed to “show off your inner geek and let the rest of world know your data skills are second to none.” There have already been lots of great submissions with people using the new SAP Visual Intelligence data discovery product.
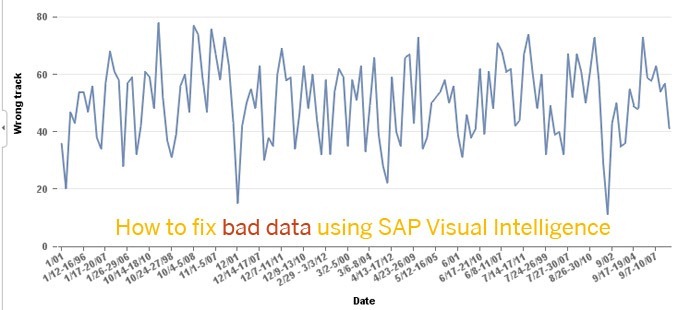
I thought I’d focus on one of the things I find most powerful: the ability to create visualizations quickly and easily even from real-life, messy data sources. Since it’s election season in the US, I thought I’d use some polling data on whether voters believe the country is “headed in the right direction.” There is lots of different polling data on this (and other topics) available at pollingreport.com.
Below you can see the data set I grabbed: as you can see, the polling date field is particularly messy, since it has extra letters (e.g. RV for “registered voter”), includes polls that were carried out over several days, and is not consistent (the month is not always included, sometimes spaces around the middle dash, sometimes not…).

If you take this data and try to paste it into Excel, it automatically converts numbers like “6/02” into the 2nd of June, further scrambling the analysis, so instead I put it directly into a text file.

To see how you can easily take the messy data and turn it into shareable analysis, I recorded a short demonstration of the steps involved:
If you’d like to try the product, you can download it for a free trial at sap.com/tryvisualintelligence. The product is undergoing very rapid iteration cycles, so please give your feedback and feature requests at the SAP Community Network Ideas Place.
Comments
5 responses to “Dancing With Dirty Data Thanks to SAP Visual Intelligence”
It looks like the old Pro-Clarity tool from many years back (its a pity Microsoft bought that and then killed it off). Can this new tool create dashboards with multiple visualizations all linked together through various filter fields?
Not yet, but the roadmap is to converge with BusinessObjects Explorer Exploration Views, which allows exactly that…
[…] Dancing With Dirty Data Thanks to SAP Visual Intelligence by Timo Elliott. […]
[…] I first saw this at: Dancing With Dirty Data Thanks to SAP Visual Intelligence […]
Amazing!!
I’ve used Tableau in the past and i’m not sure that it has the ability to do those types of on-the-fly manipulations and data cleanup presented in that video. I’ve typically had to rely on Excel or R to do the majority of the cleansing.
Can’t wait to see how this integrates.