Tag: Xcelsius
-
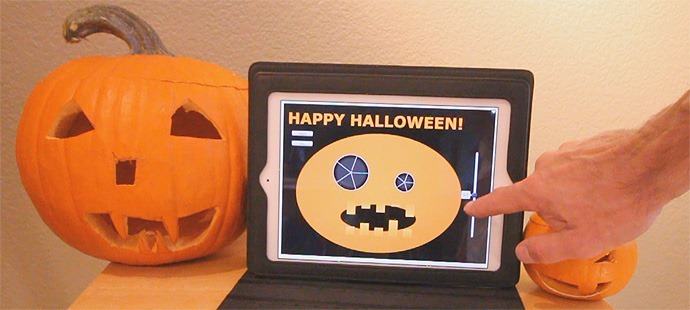
Happy Halloween HTML5 Dashboard with SAP BusinessObjects
Happy Halloween! Here’s a quick interactive HTML5 dashboard created with the beta version of SAP BusinessObjects Dashboards…
-
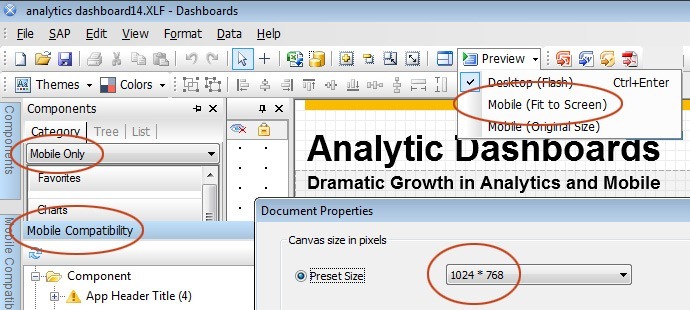
Making A Mobile HTML5 Dashboard: Follow-Up Q&A
A Q&A about creating Mobile HTML5 Dashboards with SAP Dashboards (Xcelsius)
-
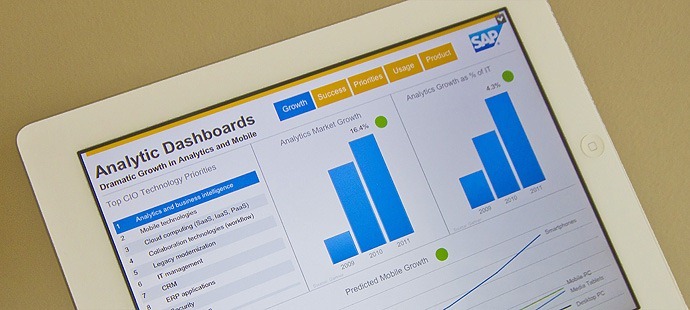
Mobile Analytic Dashboards
Mobile and Analytics were made for each other. Here’s an overview of the key mobile and analytic statistics — using a mobile dashboard
-

Concrete Examples of How Health Intelligence Saves Lives
An excellent article in Health Data Management gives some wonderful examples of the power of analytics to improve health outcomes.
-
SAP BusinessObjects BI 4.0 and EIM 4.0 Key Themes
The key messages, that summarize what’s important in the new SAP BusinessObjects BI 4 and EIM 4 releases
-
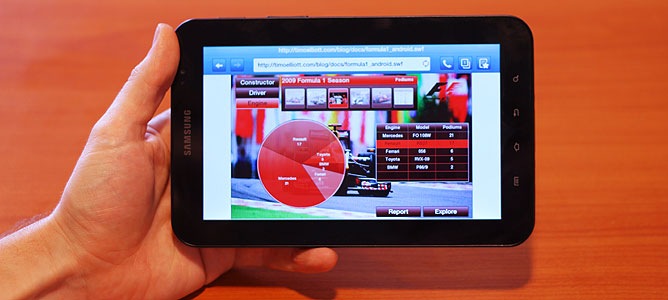
Business Analytics on the Samsung Galaxy Tab
A quick tour of business intelligence and analytics using the new Samsung Galaxy Tab.
-
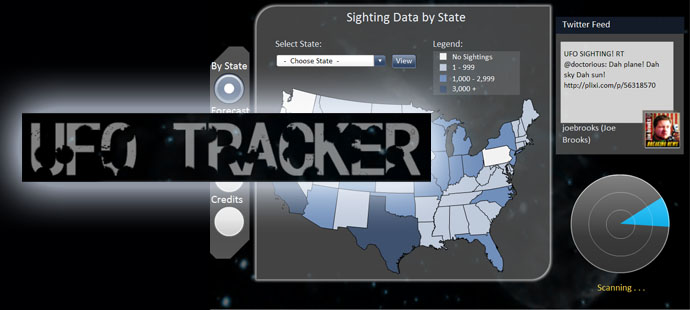
UFO Tracker Dashboard and More!
A fun UFO Tracking dashboard, one of several making up the Reportalooza.com Guest Challenge
-

Demo Jam Analytics at SAP TechEd Berlin
The SAP TechEd Demo Jam featured plenty of Analytics — here’s a small selection, including the new Augmented Explorer and Event Insight.
-

Business Intelligence in Lisbon: IT Operations Dashboards
Business Intelligence Conference day in Lisbon, Portugal, with a great example of dashboards for IT operations.
-
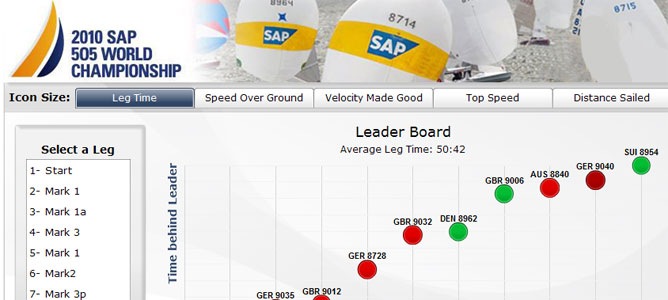
Sailing Analytics for the SAP 5O5 World Championship
A selection of sailing analytics from the SAP BusinessObjects team designed for the sailors of the SAP 505 World Championship