IBM’s Many Eyes site lets users carry out analysis over the web, using information from a range of public sources, or with data that they have uploaded, and then share their analysis with others. Interestingly, one of the team was apparently the creator of the baby name popularity chart that did the tour of the web a while ago.
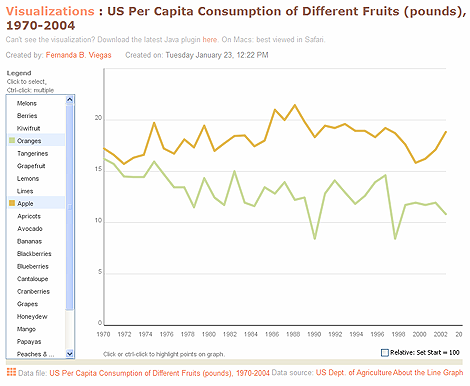
So what can you do? Here’s an example: a chart comparing the consumption of Apples and Oranges in the US from 1970-2004. (cf Stephen Few’s blog on Visual Business Intelligence).

Here are some of the analyses I thought were interesting:
- Bubble chart of the most popular free books
- Map showing cases of bird flu in humans
- Bar chart of hourly wages by occupation
- Belief in evolution: US vs other countries
The impact on BI? It’s another example of letting users generate and share content with others. Imagine this platform expanded to include all types of BI (e.g. reporting, dashboards), and shared across an organization or an industry, and combined with amazon-like scoring and wikipedia-like discussion threads.
Comments
One response to “Comparing Apples and Oranges on the Web?”
Swivel.com: Flickr for Data Lovers?
After ManyEyes, Swivel is another site that another site that lets users upload and share information. It’s more explicitly modeled after Flickr and other web 2.0 sites, with community building and “fun statistics” (highlights today include chart …