Graphwise is BI 2.0 entrant similar to Swivel and ManyEyes, but with a twist. You enter a search term, and the site scours the web for content that contains tables linked to those terms, then proposes charts based on the data in those tables.
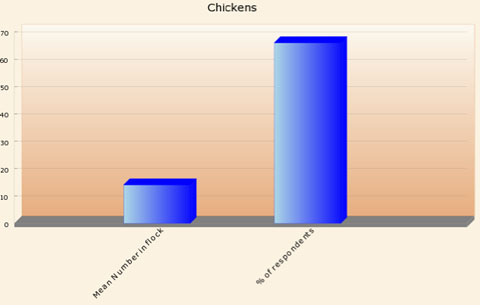
It’s a great idea, and there’s surely a great future for this technology. But there are currently some issues with relevance — e.g. I put in the search term “productivity”, and chose the first chart it offered me: the mean number of chickens in a flock, and the % of respondents?!…

The other problem is that the site uses Adobe’s SVG viewer to provide interactivity — but Adobe is pulling support for the product at the end of this year…

Of course the site is still in Beta. I wish them all the best of luck, but can’t help thinking that it’s part of a solution rather than an end-goal in itself.
At some point, will Google hoover up the different BI 2.0 offerings, integrate them with their existing analytics tools and gapminder? The result would be a compelling consumer-oriented BI solution which could then be extended to enterprise users…
