I’ve recently had the opportunity to discuss profitability analysis with a series of companies as diverse as Alcoa (Aluminum products), Otto Group (German multi-channel retailer), La Poste (the French postal service), and Heineken (surely no explanation needed?)
I’ve come away convinced not only that profitability analysis is not only an asset for all these organizations, but also that it may even be a “magic bullet” that helps promote enduring BI success.
Measuring what’s important
Is selling more and maximizing revenue a good idea? Is your best customer the one who brings in the most money? That’s certainly how most companies are organized — the sales people and regions that bring in the most money typically get the biggest bonuses.
But imagine that you’re losing money on each product — maximizing sales suddenly means maximizing your losses. To make the right decisions in your business, you have to measure the right things — and that means profits, not revenue.
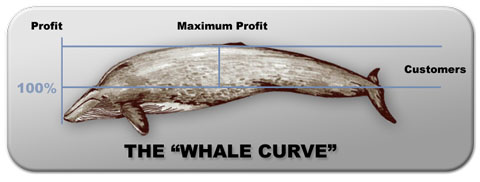
The 80/20 rule vs the whale curve
Everybody has heard of the 80/20 rule. But profitability is different — call it the “80/140 rule”: 80% of your customers or products make up more than 100% of the profits, and the remaining customers reduce the profit back down to 100%. Charting cumulative profit by customer or product typically results in what’s called a “whale curve”.
If you can generate a whale curve by customer, by product, by channel, etc, you’re well on your way to being able to make intelligent decisions about your business.
Measuring profitability — activity-based costing (ABC)
Measuring real profitability can be difficult, but new activity-based costing tools are making it much easier to build models that efficiently allocate revenue and costs according to cost drivers. For example, the cost of IT resources can be ascribed to different departments by measuring how many support calls they generate, percentage of server load, etc. Once those costs have been passed on to customer-facing departments, they can in turn be allocated according to number of transactions, deliveries, etc.

Note that things can quickly get complicated — for example, you have to allocate IT costs to the personnel department, who in turn provide services to the IT department. The best products on the market make this relatively easy, resolving this type of problem automatically through iteration.
Perhaps the biggest difficulty of implementing such systems is knowing what depth of detail and complexity is required to provide “robust” numbers. In general, companies using these solutions reported that they had initially implemented models that were too complex. But by first going “deep” they were able to reassure themselves that the simpler, more useable models they ended up using provided similar results.
Exploiting the whale curve
Profitability analysis is really about determining what drives your business. For example, Heineken can now generate detailed profit and loss statements by brand, SKU, channel, customer, segment — or any combination of these. This information is used widely throughout the company, for example to determine at what point it becomes profitable to install a more complex “cellar beer” installation instead of a normal draught installation.
After implementing these solutions, company managers typically find that at least some of the the rules of thumb that they have using to run their businesses were incorrect. In many cases, their “best customers” turned out not to be the most profitable, because they demanded more time and attention and generated higher costs.
By determining profitability by customer segment, organizations can adapt their services accordingly. For example, banks can target marketing campaigns at the types of customers which provide them with the highest profitability, and try to encourage higher-cost customers to move to cheaper telephone or online ebanking services.
In extreme cases, companies like Sprint and UK’s online bank, Egg, have even attempted to “fire” their least-profitable customers — a good example of why human beings remain essential to all performance management systems, since a good accounting decision can be a very bad PR decision.
The foundation of strategic BI?
As the BI industry has matured over the last two decades, it has become increasingly important to organizations.
But my experience has been that BI and performance management projects designed for the executive team tend to be “brittle” — even when they have clearly provided great value, they often fall victim to the next big corporate reorganization and management reshuffle.
Partly this has been because of technology issues — there are still improvements to be made in how easy it is to update BI systems as goals change — but I believe it mainly comes down to more human factors.
It’s taken as gospel within our industry that strong executive leadership is essential for strategic BI. But the danger is that the project becomes strongly associated with a particular leader. And when that person leaves (and executive turnover has been increasing), their successor instinctively reaches for a different system and different metrics to mark the departure from the “old way of doing things”.
This is where profitability shines as a “magic bullet”. Simply put: nobody messes with profitability. A new executive is coming in and wants to see a different set of metrics? No problem: since nobody can argue with the importance of profitability, people don’t even try.

It appears that profitability can provide a strong foundation on which to build an enduring BI system. The hope is that the new executives will have an incentive to make their mark by acting on the different drivers of profitability, and extending and improving the existing performance systems, rather than dismantling them and starting again.
In conclusion, if organizations really care about implementing strategic BI and performance management projects, they should consider starting with a core foundation of profitability analysis.
Comments
2 responses to “Profitability Analysis: The “Magic Bullet” for Strategic BI Success?”
Nice article.
The 80/140 Rule is similar to the results of a recent scientific sales management research article (Managing Dynamics in a Customer Portfolio by Homburg, Steiner & Totzek in Journal of Marketing Vol. 73)
There they find that the usual “static” customer value calculation overestimates the top tier customers and neglects the value of the middle tier customers.
A dynamic approach shows better results and gives insight how to deal with different customer segments.
The CLV Calculation there is also done by BI Software from SAS using data-mining and shows that there is a huge potential for using those technologies in customer management.
Matthias Heid, SAP
Tim,
I totally agree with you about the need to apply activity-based costing methods to measure customer profitability. In the B2C domain, I realize there is also need to extend this to evaluate the future potential of a customer. This involves a customer lifetime value (CLV) calculation. But there is little consensus on how to apply this metric. Consequently, I have asked a professional society to fund research on this topic, and the grant proposal Web link is at:
http://www.imanet.org/research_foundation_call.asp#A
I welcome dialog. — Gary Cokins, SAS