Skip to content
Digital Business & Business Analytics

Digital Business & Business Analytics

Timo Elliott's Blog

  • About
    • Subscribe To New Posts
    • Presentations
    • Privacy Policy
  • Analytics Cartoons
  • More Analytics Cartoons
  • Cartoons
  • Analytics Book [DRAFT]
    • What is Analytics?
    • Why Analytics?
    • How Analytics?
Posted on May 18, 2009 by Timo Elliott

The Inevitable Wolfram|Alpha Problem: Semantics

Now that Wolfram|Alpha has launched, I thought I’d go take a look. After failing to find out the average happiness of France vs US (not a supported database yet, apparently), I tried out some of the examples and then checked out the “community” area.

Inevitably, Wolfram|Alpha suffers from the same problems that have plagued every attempt to provide answers to human questions using technology since the dawn of computers: semantics, and specifically meaning and syntax. These are nicely illustrated in some of the questions posted in the forum.

Meaning:

  • Is Scotland a country, or a town in Connecticut?
  • Does “Sun” mean a planet, or is it short for “Sunday”?

Syntax:

  • circumference earth / distance london auckland
  • Cross referencing doesn’t work

There are technology vendors in both these areas that could bolster Wolfram|Alpha’s capabilities. For example the problem of syntax, although considerable, is now largely solved at least for the types of instructions that Wolfram|Alpha is interested in. And I’m sure it won’t take long before a better database helps the company discover Scotland.

The long-term problem of understanding metadata remains challenging, however – especially within organizations. Indeed, most of the effort of implementing business intelligence projects often goes into trying to determining what people are trying to measure – i.e. which data sources need to be connected to each other, and how common business terms should be calculated. It’s one of those areas that exasperate business users: “how hard can it be to give me sales revenue by product?!” – but the IT department understands that the devil is in the details.

For example, at the SAPPHIRE user conference last week, I attended a session where a presenter from Kroger explained that during their BI implementation they had found six different definitions of “sales” and four of “gross profit” – all of them legitimate in certain circumstances. Trying to figure out which one to use when was one of the key challenges of the project.

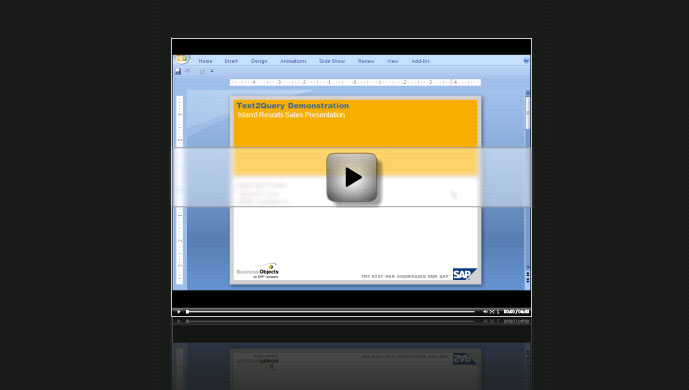
Once this hard work is done, though, it becomes a very valuable resource that can then be leveraged throughout the organization. For example, a new prototype is available that automatically suggests corporate charts as people type in a PowerPoint slide. It uses the metadata from the existing BI installation, and combines it with SAP BusinessObjects’ Text Analytics technology to provide something that looks a little like magic to the average business user – see the demo below.

image

Share this:

  • Click to share on Twitter (Opens in new window)
  • Click to share on LinkedIn (Opens in new window)
  • Click to share on Facebook (Opens in new window)
  • Click to share on Reddit (Opens in new window)
  • Click to share on Pinterest (Opens in new window)
  • Click to email this to a friend (Opens in new window)
CategoriesUncategorized TagsBest practice, Business Intelligence, BusinessObjects, metadata, SAP, SAPPHIRE, sapphire09, WolframAlpha

Post navigation

Previous PostPrevious Here Comes Web 3.0: Wolfram|Alpha Launches Today
Next PostNext Jonathan Becher’s SAPPHIRE 09 Blog

Welcome!

Timo ElliottI am an Innovation Evangelist for SAP. This blog only contains my personal views, thoughts and opinions. It is not endorsed by SAP nor does it constitute any official communication of SAP. You should follow me on Twitter and Subscribe by email

Subscribe to Blog via Email

Enter your email address to subscribe to this blog and receive notifications of new posts by email.

Join 23,653 other subscribers

Popular Posts

  • Predictive Is The Next Step In Analytics Maturity? It’s More Complicated Than That! 14.50 views per day
  • How to Become A Technology Evangelist 10.50 views per day
  • Some Tips On Interactive Virtual Presentations 7.83 views per day
  • An Equipment List For Virtual Presentations In An Office Or Home Studio 6.50 views per day
  • Here Comes Web 3.0: Wolfram|Alpha Launches Today 4.50 views per day
  • Technology Is Evolving Faster Than We Are! What Can We Do About It? 4 views per day
  • The 5 Ingredients of Good Decision-Making 3.17 views per day
  • Data Ownership: The Next Big Data Threat and Opportunity 2.33 views per day
  • Business Analytics vs Business Intelligence? 2.17 views per day
  • data-lake-to-data-swamp-cartoon.jpg From Data Lakes To Data Swamps 2 views per day

Timo on Twitter

Tweets by timoelliott

Follow @timoelliott

Search

Categories

Privacy Policy Proudly powered by WordPress
loading Cancel
Post was not sent - check your email addresses!
Email check failed, please try again
Sorry, your blog cannot share posts by email.