Infographics are visual representations of information, data or knowledge intended to present complex information quickly and clearly. They are incredibly popular in social media, because they work. Here are some of the favorite infographics of Fast Company magazine. And there are, of course, infographics about infographics – even interactive ones.
But what turns an infographic into an infauxgraphic? If it’s ugly, silly, misguided, or misleading.
Ugly
Some infauxgraphics are just really ugly.
Silly
Some infauxgraphics may just be silly or funny.

Misguided
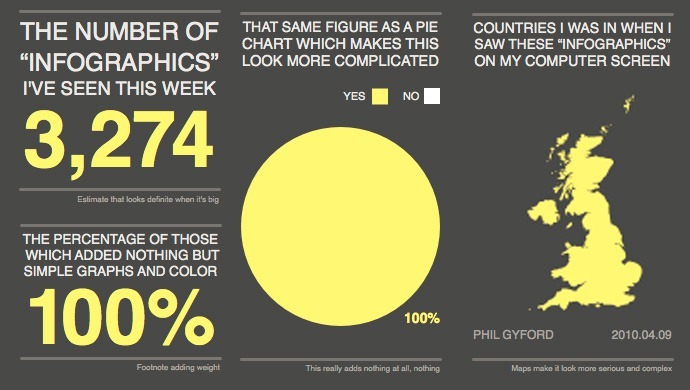
Infauxgraphics may be misguided, and fail in their mission by concentrating on graphic design rather than information design. This is by far the most common problem: the design is visually arresting, but gets in the way of understanding, using pointless or uninteresting facts. Here’s a great spoof adapted from a piece by Phil Gyford — click to see the original in its full glory.
Misleading
Worst of all – and heavily used in any area that is even mildly controversial – an infauxgraphic may be unintentionally or deliberately misleading.
Please be merciful to us all – if you have to make infographics, please make sure they’re not infauxgraphics!


Comments
4 responses to “What Are Infauxgraphics?”
[…] kicked’ in a career advice piece – works for me. Mark Suster’s autobiographical If You Don’t Define Your Personal Brand, the Market Will works as a companion […]
[…] What Are Infauxgraphics? | Business Analytics […]
Hi Timo,
The last image link is broken, and it looks like it’s the best one. Please fix 🙂
Josh
I added a link to the image (same as the previous link in the text) — hope that fixes it?