Tag: Chart
-

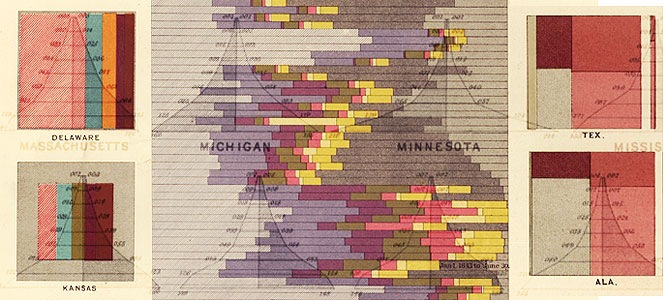
Stunning Business Intelligence Visualizations… from 1870
As any reader of Edward Tufte knows, data visualization has been around a long time. Here’s some nice examples from the 1870 US census.
-

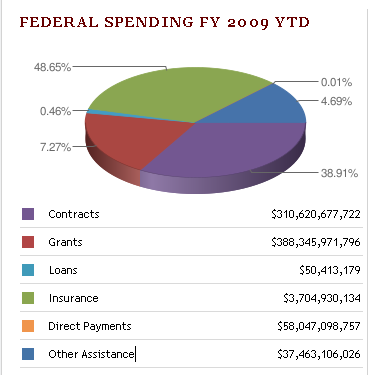
BI FAIL #2
Business Intelligence Fail #2 — showing a chart that’s completely different from the data, on the site USAspending.gov