Tag: Dashboard
-
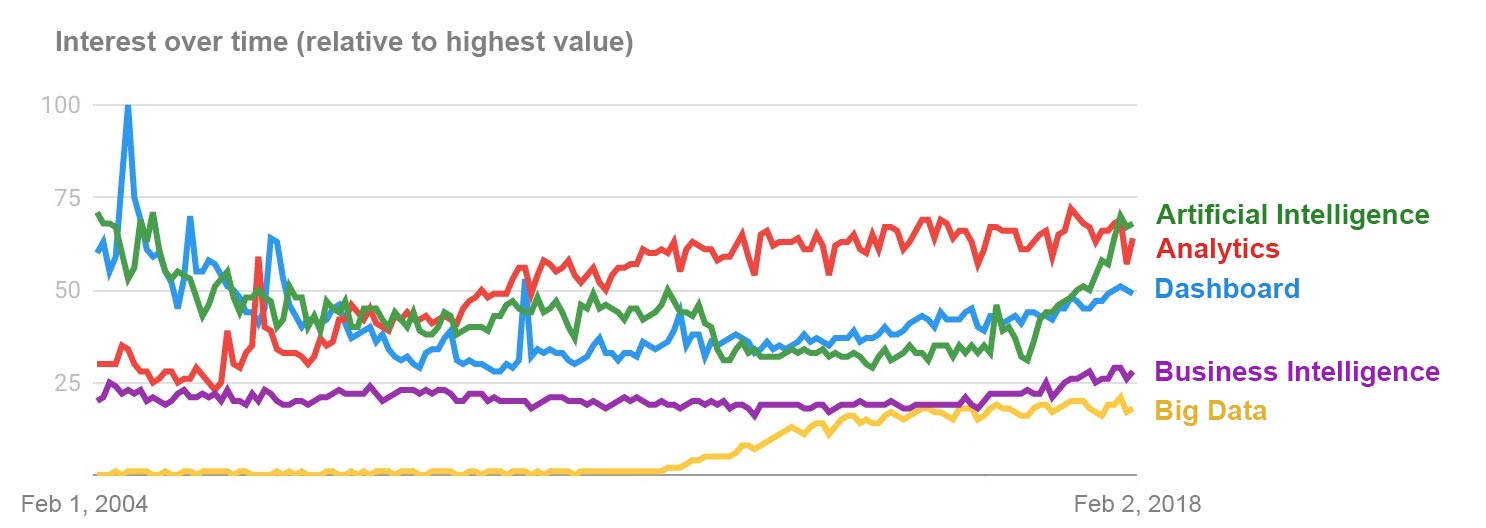
Is Big Data Dead? Are Dashboards Obsolete?
Which terms are hot and which are not in the world of analytics?
-
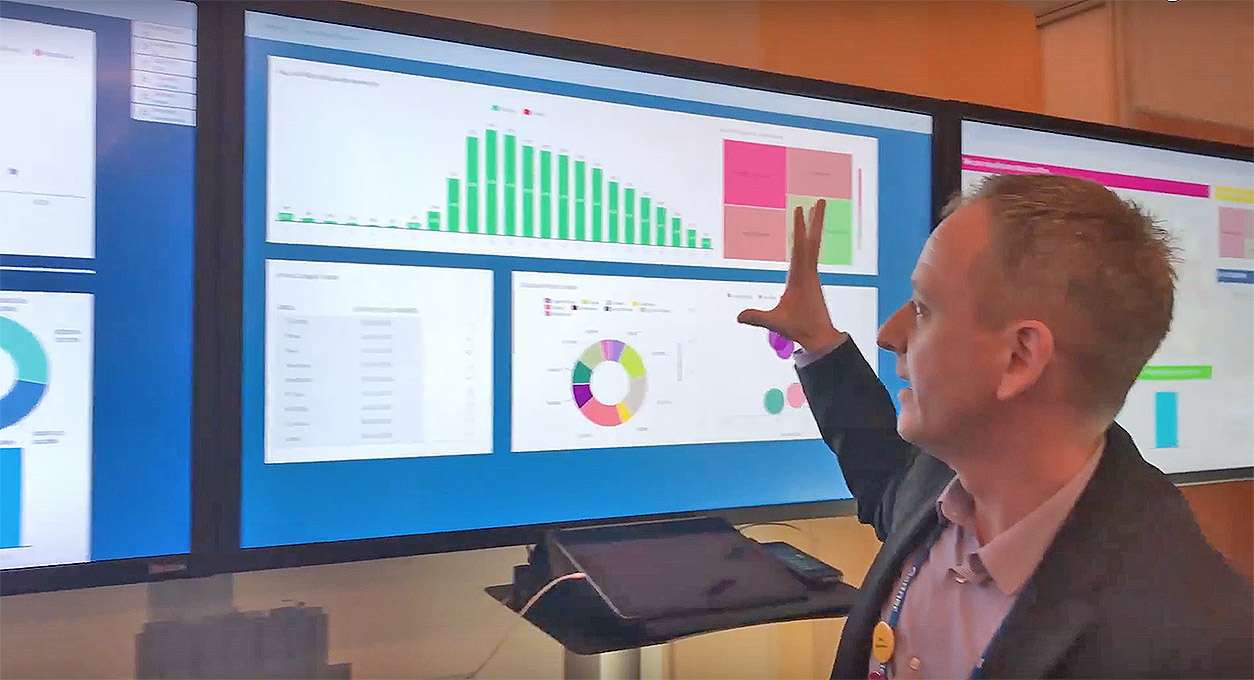
Northern Gas Networks’ SAP Digital Boardroom Demo
Tom Pollock of Northern Gas Networks demos SAP Digital Boardoom
-
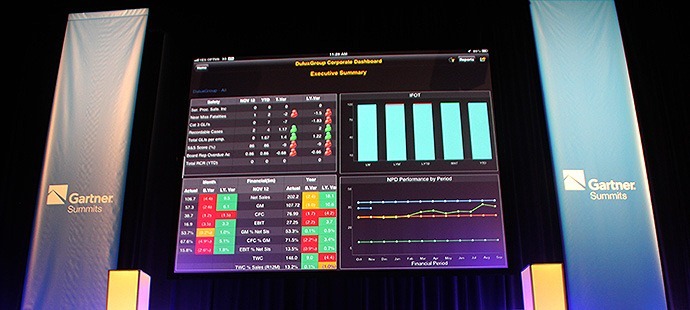
Dulux Group Wins Gartner BI Excellence Award for Mobile BI Dashboards
Dulux Group won Gartner’s coveted “BI Excellence Award” for their Mobile BI Dashboard implementation
-
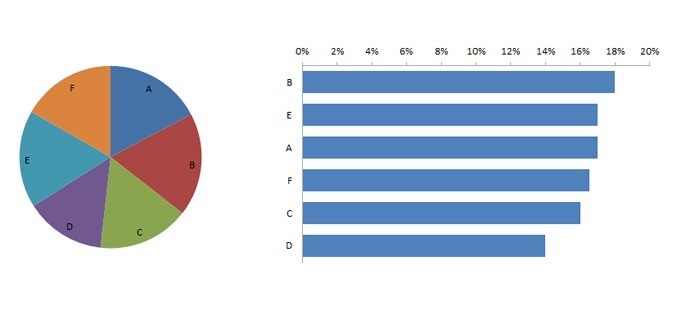
Brain Scans Show No Difference in Pie Chart and Bar Chart Perception?
Which is better for communicating information: pie charts or bar charts? Tufts researchers throw doubt on a common data visualization belief.
-
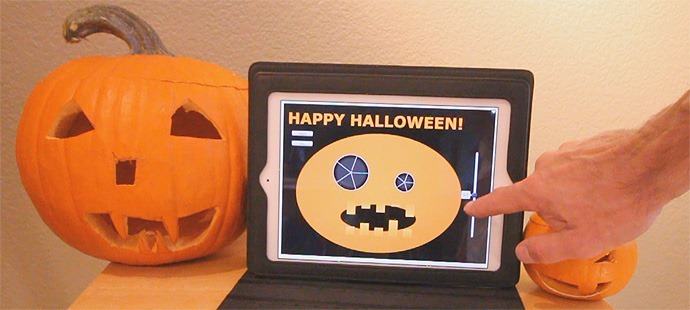
Happy Halloween HTML5 Dashboard with SAP BusinessObjects
Happy Halloween! Here’s a quick interactive HTML5 dashboard created with the beta version of SAP BusinessObjects Dashboards…
-
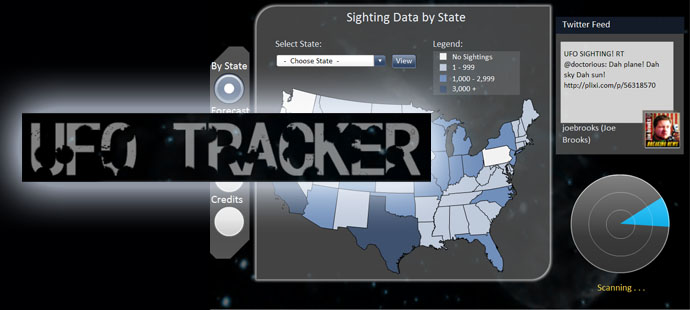
UFO Tracker Dashboard and More!
A fun UFO Tracking dashboard, one of several making up the Reportalooza.com Guest Challenge
-
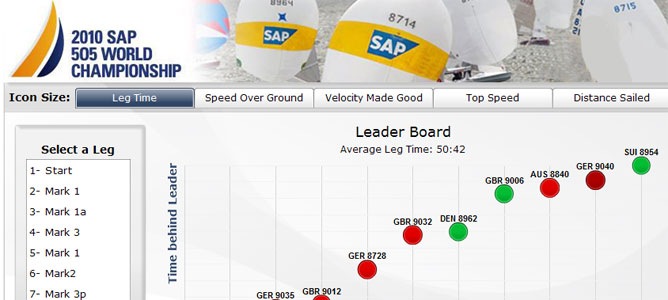
Sailing Analytics for the SAP 5O5 World Championship
A selection of sailing analytics from the SAP BusinessObjects team designed for the sailors of the SAP 505 World Championship
-
An Introduction to the SAP 5O5 World Sailing Championships 2010
It’s the SAP 505 World Sailing Championships this week in Aarhus, Denmark. Here’s a quick introduction to the sport, and a review of the SAP BusinessObjects performance dashboard provided to last year’s sailors.
-
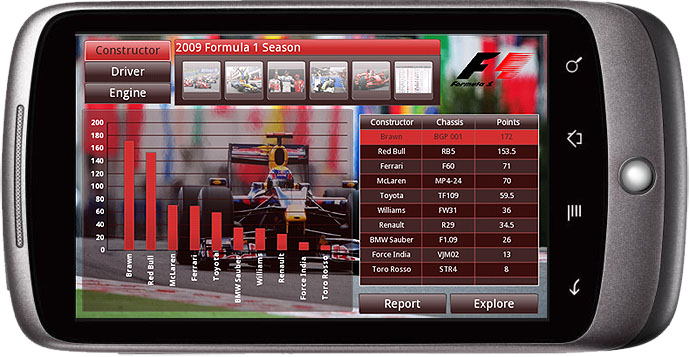
Xcelsius Dashboards on Your Android Mobile Phone
A demonstration of SAP BusinessObjects products including Xcelsius Dashboards, Web Intelligence Reports, and Explorer working on an Android-based Google Nexus One phone.
-

Season’s Greetings with Xcelsius!
Season’s Greetings with an Interactive, Twitter-based Xcelsius Dashboard