x
Digital Business & Business Analytics
Facebook Twitter Linkedin Youtube Tumblr Instagram RSS Email

Main menu

Skip to content
  • About
    • Subscribe To New Posts
    • Presentations
    • Privacy Policy
  • Analytics Cartoons
  • More Analytics Cartoons
  • All Cartoons

Tag Archives: Dashboard

Uncategorized

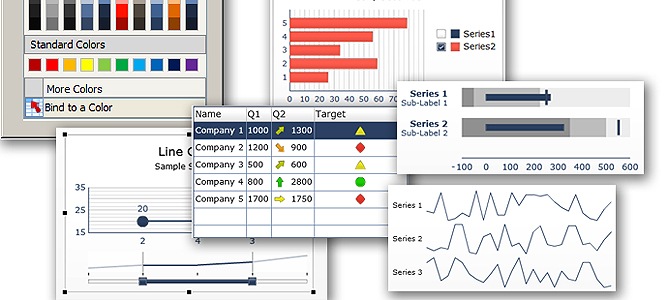
What’s New in SAP BusinessObjects Xcelsius 2008 SP3?

Author Timo Elliott Date December 15, 2009

Here’s a summary of some of the new things in the latest features and components in SAP BusinessObjects Xcelsius 2008 SP3

Tagged Analytics, BI, Business Analytics, Business Intelligence, BusinessObjects, Dashboard, SAP, SP3, Xcelsius | 31 Comments |
Uncategorized

BI for Baby: Dashboards to Track Your Child’s KPIs (And The Rest of Us)

Author Timo Elliott Date November 28, 2009

You can now track a slew of key performance indicators for your baby — how long before this becomes part of our own daily lives?

Tagged Analytics, Baby, BI, Business Analytics, Business Intelligence, BusinessObjects, Dashboard, SAP | 2 Comments |
Uncategorized

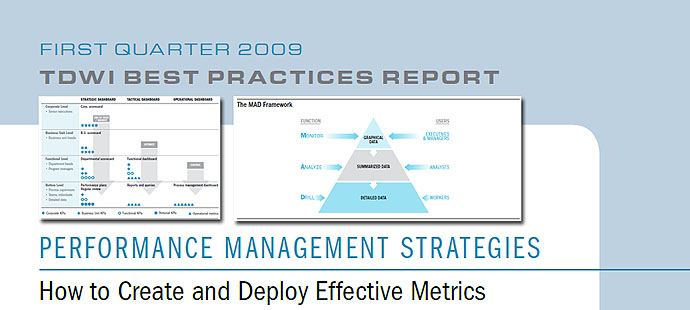
How to Create and Deploy Effective Metrics

Author Timo Elliott Date September 18, 2009

Performance metrics are a powerful tool of organizational change, but the wrong metrics can have unintended consequences. How should you choose KPIs and implement dashboards? TDWI explains.

Tagged Business Analytics, BusinessObjects, Dashboard, KPIs, Performance Management, SAP, Xcelsius |
Uncategorized

Grand Prix Business Intelligence

Author Timo Elliott Date August 31, 2009

Last week I had the opportunity to attend a corporate event at the Belgian Grand Prix, and present an SAP BusinessObjects product overview and roadmap.

Tagged Belgium, Business Intelligence, BusinessObjects, Dashboard, Grand Prix, Information Overload, Presentation, SAP | 4 Comments |
Best practice

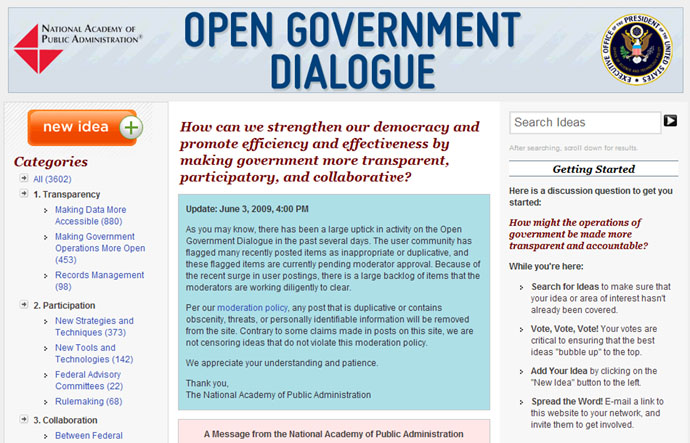
Great Examples of US Government BI Transparency

Author Timo Elliott Date July 1, 2009

Since the US has now appointed its first ever “Chief Performance Officer”, it seems like a great time to talk about other great examples of US government transparency and business intelligence.

Tagged Benchmarking, BI, BI competency center, Business Intelligence, Dashboard, Public Sector, SAP, Transparency, Xcelsius | 3 Comments |
Uncategorized

Drink Dispenser Analytics: Coca-Cola Goes Freestyle, With Help from SAP BI

Author Timo Elliott Date June 19, 2009

Coca-Cola has introduced a new RFID-enabled drink dispenser that serves over 100 flavors and wirelessly beams information to an SAP BW datawarehouse in Atlanta, ready for advanced analytics.

Tagged Analytics, BI, BusinessObjects, Customer, Dashboard, SAP, Supply Chain, Xcelsius | 2 Comments |
Uncategorized

Scandalous Financial Benchmarking?

Author Timo Elliott Date March 20, 2009
I just stumbled across an old post of mine, and couldn’t help reposting some...
Tagged Benchmarking, BI, Business Intelligence, Cartoon, Dashboard, Humor, Xcelsius |
Uncategorized

SAP Dashboards at Microsoft?

Author Timo Elliott Date March 17, 2009

According to the Treasury & Risk site, Microsoft is a keen user of SAP dashboards, at least in conjunction with their treasury needs

Tagged Dashboard, Microsoft, SAP, Xcelsius |
Uncategorized

BI in Bahrain

Author Timo Elliott Date March 13, 2009

here was lots of interest in the SAP BusinessObjects portfolio of solutions at the SUG-MENA event in Bahrain. See the Xcelsius dashboard using local data, and the presentation I gave.

Tagged Bahrain, BI, Business Intelligence, BusinessObjects, Dashboard, SAP, SUGMENA, User Group, Visualization, Xcelsius | 2 Comments |
Web 2.0 by SAP

SAP’s Collborative Sustainability Strategy

Author Timo Elliott Date March 2, 2009

SAP recently announced its intention to collaborate closely with its customers and partners as part of a sustainability strategy that includes aggressive carbon reduction targets, a new cross-functional sustainability organization, and sustainability solutions for customers.

Tagged BusinessObjects, Collaboration, Dashboard, EHS, GRC, Green IT, SAP, Strategy, Sustainability, Xcelsius |

Post navigation

← Older posts
Newer posts →
Categories
  • Analytics Roundup
  • Best practice
  • BI 2.0
  • BI Briefs
  • BI FAIL
  • Cartoons
  • Conferences
  • Deployments
  • Interviews
  • Other
  • Presentations
  • Products
  • Roundup
  • SAP Web 2.0
  • Social
  • Thoughts
  • Uncategorized
  • Visualization
  • Web 2.0 by SAP
  • Web 2.0 in SAP
  • Web 2.0 with SAP
Latest Posts
  • Cartoon: Innovation Acceptance Challenges!
  • What I Learned At Gartner Data & Analytics 2022
  • Culture Eats Technology For Breakfast
  • Becoming an Intelligent, Sustainable Enterprise with SAP
  • Innovation: where do you start? metrics can help...
  • Better Together: Customers Talking about Innovation with SAP Business Technology Platform
  • SAP Industry Insights Podcast Highlights of 2021 with Host Tom Raftery
  • Dark Data: How to Find It and What to Do with It
  • "Data is the closest thing to magic in the modern world..."
  • What is Dark Data, Why Does it Matter, and Why Are Humans Still Needed?
Recent Comments
  • Timo Elliott: David, Please go ahead, you have my full permission… Regards, Timo
  • David Green: Hi Timo, Great cartoons! Would it be possible to use any, with attribution/link
  • | What I Learned At Gartner Data & Analytics 2022 – niceretrotube: […] Resource link […]
  • Tom: Hi Timo - These are excellent. I'd like to use some of your cartoons for Busine
  • Urvashi: The first one
  • Timo Elliott: Jessica, thanks for letting me know. Best of luck with your presentation!
  • Timo Elliott: Kate, please go ahead...
  • Kate James: Hi Timo I would like to use your cartoons to illustrate the different topics co
  • Jessica M.: Hi Timo, Your cartoons are great! I am hoping to use "I actually have data"
  • Timo Elliott: Marcus, please go ahead, honored that they’re used at SAP trainings!
Archives
  • July 2022
  • May 2022
  • February 2022
  • January 2022
  • July 2021
  • March 2021
  • February 2021
  • January 2021
  • November 2020
  • October 2020
  • August 2020
  • July 2020
  • March 2020
  • January 2020
  • October 2019
  • September 2019
  • August 2019
  • July 2019
  • June 2019
  • February 2019
  • January 2019
  • December 2018
  • November 2018
  • October 2018
  • September 2018
  • August 2018
  • July 2018
  • June 2018
  • May 2018
  • April 2018
  • March 2018
  • February 2018
  • January 2018
  • December 2017
  • November 2017
  • October 2017
  • September 2017
  • August 2017
  • July 2017
  • June 2017
  • May 2017
  • April 2017
  • March 2017
  • February 2017
  • January 2017
  • December 2016
  • November 2016
  • October 2016
  • September 2016
  • August 2016
  • June 2016
  • May 2016
  • April 2016
  • March 2016
  • February 2016
  • January 2016
  • December 2015
  • November 2015
  • October 2015
  • September 2015
  • August 2015
  • July 2015
  • June 2015
  • May 2015
  • April 2015
  • March 2015
  • February 2015
  • January 2015
  • December 2014
  • November 2014
  • October 2014
  • September 2014
  • July 2014
  • June 2014
  • May 2014
  • April 2014
  • March 2014
  • February 2014
  • January 2014
  • December 2013
  • November 2013
  • October 2013
  • September 2013
  • August 2013
  • July 2013
  • June 2013
  • May 2013
  • April 2013
  • March 2013
  • February 2013
  • January 2013
  • December 2012
  • November 2012
  • October 2012
  • September 2012
  • August 2012
  • July 2012
  • June 2012
  • May 2012
  • April 2012
  • March 2012
  • February 2012
  • January 2012
  • December 2011
  • November 2011
  • October 2011
  • September 2011
  • June 2011
  • May 2011
  • April 2011
  • March 2011
  • February 2011
  • January 2011
  • December 2010
  • November 2010
  • October 2010
  • September 2010
  • August 2010
  • July 2010
  • June 2010
  • May 2010
  • April 2010
  • March 2010
  • February 2010
  • January 2010
  • December 2009
  • November 2009
  • October 2009
  • September 2009
  • August 2009
  • July 2009
  • June 2009
  • May 2009
  • April 2009
  • March 2009
  • February 2009
  • January 2009
  • December 2008
  • October 2008
  • September 2008
  • August 2008
  • July 2008
  • June 2008
  • May 2008
  • March 2008
  • February 2008
  • January 2008
  • December 2007
  • November 2007
  • October 2007
  • September 2007
  • August 2007
  • July 2007
  • June 2007
  • May 2007
  • April 2007
  • March 2007
  • February 2007
© Digital Business & Business Analytics