
In my previous post, I showed a dashboard that I created with SAP BusinessObjects Dashboards, exported to HTML5, and viewed through SAP BusinessObjects Mobile. I thought I’d do a follow-up in Q&A format (none of these questions were asked by real people, but please feel free to ask your own questions in the comment section below!).
Before reading, if you haven’t already done so, you should take a look at the post by Tammy Powlas, Mobilizing Your Dashboards: ASUG Webcast, which answers a lot of the product-related questions you may have.
How hard was it to create the dashboard for HTML5?
It was pretty much the same as creating any other dashboard – the main differences were:
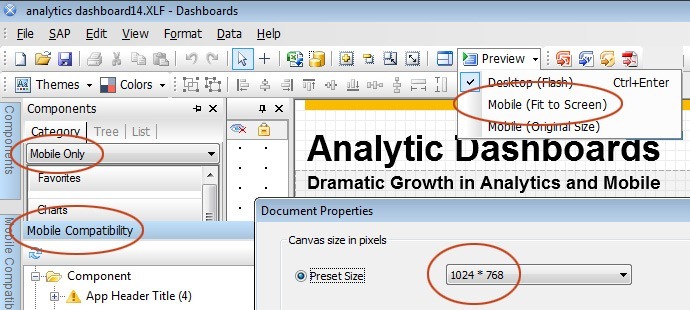
- I started with the right size for an iPad screen, 1024×768
- I checked that the components/parameters I was using were supported for HTML5 (new settings let you limit the list to only the supported components when creating a dashboard, and check the compatibility of existing dashboards)
- I chose guaranteed-iOS compatible fonts (Arial, etc. – otherwise, the embedded browser will try to use the best font it can, but spacing might be off)
- I used the mobile viewer option to see how it would look on an iPad
- I exported to the server to be able to open view the dashboard using the SAP BusinessObjects mobile application on the iPad (the final result looked and worked just like the preview, except for some tiny differences in spacing)
The only other issue I had was aligning the right versions of full-client designer, server, and mobile client, since they’re all in beta.
My overall reaction was pleasant surprise – the new version did pretty much exactly what I wanted it to do: let me leverage my existing Dashboard skills, but for a mobile device.
What components aren’t yet available that you would have wanted?
This was a pretty straightforward dashboard, and with only static data, so I had everything I needed – the development team have clearly started with the most commonly-used components.
One thing I did run into was that not all the parameters are supported in the components you can use. I didn’t care about most of these (e.g. you can’t control the color of scroll bars on text fields), but there was one I found limiting: you can’t currently have data value labels appear on bar/line charts (they are available with a mouse over – i.e. when you touch the chart with your finger).
Since I didn’t want to always have to click on the charts, I added a few “text label’ components to show some of the key values on the charts as a workaround, (it’s not too bad – if I update the data, the values of the labels will update, too, but the spacing might not be correct).
It is also worth noting that you get some features in the mobile version that aren’t available in Flash – for example you can use a “pinch” gesture to zoom into a chart, then swipe to see different sections of that chart. You can see SAP’s Matt Lloyd demonstrate that feature and more in his Mobile Minute video.
Did you do anything else differently?
To maximize the available space, and make the dashboard as clear as possible, I turned off as many of the chart component defaults as I could (backgrounds, axes, lines, labels, legends, etc.) – but this is pretty much also best practice for non-mobile dashboards, too.
After initial testing, I made all the buttons bigger (and so ditched the default buttons), and I added invisible buttons on the lower left and right-hand corners, to be able to page through the different screens with my thumbs…
Ideally, I also would have liked to be able to use some tablet-specific gestures to control the dashboard – for example, to be able to swipe to move from one “page” to another – maybe in a future version?
What was the beta quality like?
Pretty solid — there were some minor screen refresh issues, and a couple of times it somehow substituted the local file name with the DOS filename, or the name I wanted it to appear under on the server. I had one crash — but my computer is cranky anyway, so I can’t really tell if the beta was the cause. The first version I tested had some old, unused components from a previous project in the background, and I got a memory error on the iPad, but that went away once I’d deleted them.
Did you think about using Design Studio instead?
I have been playing around with Design Studio (formerly known as project Zen) and at some point I’d like to write up what I see as the differences. But for this project, I only had spreadsheet data, and Design Studio currently only connects to BW/HANA, so it wouldn’t have been an option.
You used pie charts – what’s wrong with you? Haven’t you ever read [insert viz guru]?!
If we’re going to get confrontational, I should start by saying that I’m pretty sure that my library of visualization books is bigger than yours.. 🙂
I did it deliberately (and the completely unnecessary cover art, and the quotes), to annoy the Few people who get really upset about that (and because I’m not trying to run my business with this dashboard!). I’m a big fan of good visualization, but I can’t stand the dogma and polemicists that seem to abound in this area.
Can you view/extend the HTML5?
No — you can only access the resulting HTML5 dashboard using the SAP BusinessObjects Mobile client, and there’s no way to see (or tweak/manipulate) any of the actual code generated.
How does it compare to other mobile analytics solutions?
I can’t really speak to the solutions from other BI companies, but if you’re looking to leverage your SAP BusinessObjects solutions, then the new version of Dashboards looks like a great choice.
You can also take a look at SAP partners like Antivia, Exxova, Cleartelligence and independent vendors like RoamBI, who have complementary mobile analytic products. SAP intends to work with partners to extend today’s Dashboards extensions to the HTML5 world as appropriate.
Comments
3 responses to “Making A Mobile HTML5 Dashboard: Follow-Up Q&A”
This is great news! My organization is in the process of ditching Xcelsius in favor of a different dashboard solution, and this may get them back to using it (the alternative they chose sucks and will not be named).
You write: Can you view/extend the HTML5?: no.
Is the file not stored in the BusinessObjects FRS? Can it not be accessed via the filesystem and viewed/ altered in notepad?
Good question — I’m afraid I don’t know… Obviously it wouldn’t be supported…
Timo,
This is great news. I’m positively surprised about some of the features, including offline access. Also the option to leverage the ‘annotations’ functionality of the SAP BI mobile app is a real plus.
The proof of the pudding is in the eating but I’m starving right now so bring it on!
– Pieter