
Here’s a summary of some of the new things in the latest version of Xcelsius 2008. I’ve borrowed liberally from the official documentation that you can download, along with the program, here.
New Components
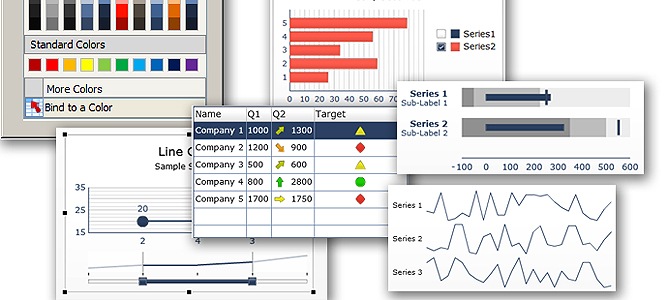
Sparkline chart components. The new Sparkline chart is based on the Sparkline chart created by Edward Tufte and provides a method for displaying a one-dimensional range of numeric data in a way that is dense, takes up a small space, and can be quickly interpreted. It is useful for creating small, data-intense graphs to show trends and variations associated with a specific measurement, such as stock market activity.

Designers can set key data points (start value, end value, low value, and high value) that will be displayed as markers on the Sparkline chart. They can also define a normal range that will be displayed as a colored background behind the chart.
Bullet chart components. Two new charts Horizontal Bullet Chart and Vertical Bullet Chart components are available, similar to those designed by Stephen Few.

The Bullet Chart components have a single primary measure (for example, current year-to-date revenue) that is displayed as a vertical or horizontal bar.A marker indicates a target or performance goal and changing color hues behind the bar indicate qualitative ranges of performance (for example: poor, satisfactory, and good).
Designers can configure the Bullet Chart to display multiple series and can configure the scale, axis, and ticks separately for each series. For example, the chart can be configured to show revenue in thousands of dollars, profit in dollars, and order size as a count.
Scorecard Selector component. A new selector component is available that allows you to display visual alerts in a grid. At runtime, users can click column headings to sort the grid on the column’s data.

The new Scorecard selector component is similar to the List View selector component, but includes options to enable and configure alerts in columns and to add headers that allow users to sort the columns at runtime. Alert levels can be displayed with cell background colors, font colors, or alert icons with or without values.
Canvas container component. A new container component is available for creating an invisible container. The new Canvas container component is similar to the Panel container component, but it does not have any art (for example, background, borders, heading bar, and so on.)

In design mode, the container is visible to allow the designer to work with the component, but when the model runs, the container is invisible so components in the container appear to be free floating. If the components in the Canvas container extend beyond the container borders, scrollbars are added.
Push Button component. A new selector component allows users to restore Single Value components to their default values without resetting the values for the entire model.

The new Push Button component can be configured to set the values of one or multiple cells to specific values when the button is pushed. The values change only when the user pushes the button, so users have more control over when the data is copied to the destination cells.
SWF Loader component. A new web connectivity component is available for loading SWF files at run-time. The SWF Loader component is similar to the Slide Show component, but it is simpler and has better memory management. The new SWF Loader enables you to load both Xcelsius and non-Xcelsius SWF files at run-time. Unlike the Slide Show component, it does not provide transition effects when moving from one file to another and it does not allow you to block user interaction.
It does have some advanced options that I believe offer the opportunity to load more sophisticated SWF files and have them interact with the model.


New Features
Chart data labels. A new option is available to overlay data labels on or around chart markers. The Properties panel for chart components now includes a Data Labels option on the Appearance > Text tab. When selected, data labels are visible for the chart markers. If designers don’t want labels to display for some series, they can expand the Data Labels list and deselect the series.

Designers can specify the values used for the labels, the label position, and, if applicable, add leader lines. The options available for configuring the labels depends on the type of chart.
Chart range slider. For many chart components, you can now add a range slider to allow users to focus on a particular data set rather than viewing the entire chart at once. When the Enable Range Slider option is selected on the chart properties panel, on the Behavior > Common tab, designers can specify the beginning and end range for the slider and set the range labels.

At runtime, the range slider appears below or to the left (for bar charts) of the chart and allows users to select the data range that is shown in the chart. Users can change the size of the range by adjusting control handles on either side of the range slider.
The Enable Range Slider option is available for the following charts:
- Line
- Stacked bar
- Column
- Stacked column
- Candlestick
- Combination
- OHLC
- Area
- Stacked Area
Chart sorting. A new Enable Sorting option on the chart properties panels (Behavior > Common) allows designers to sort the chart data by data values or category labels and for a single series or multiple series. (see graphic in previous section)
When designers select the Enable Sorting option on the chart “Properties” panel, they can choose to sort the chart by data or by category labels. If the chart contains multiple series of data and sort by data is selected, the designer can also specify which series the data will sort on.
The Enable Sorting option is available for the following charts:
- Line
- Pie
- Column
- Stacked column
- Bar
- Stacked bar
- Combination
- Area
- Stacked area
- Radar
- Filled radar
Show/hide series at runtime. A new chart property, Enable Hide/Show Chart Series at Run-Time, is available when legends are enabled. When the property is selected, users can select which series are shown in the chart.
On the Appearance > Layout tab, when Enable Legend is selected, designers can select the Enable Hide/Show Chart Series at Run-Time option. If selected, at run-time, users can deselect checkboxes or click the series name in the legend to remove the series from the chart display.

Runtime:

The Enable Hide/Show Chart Series at Run-Time option is available for the following charts:
- Line
- Column
- Stacked column
- Bar
- Stacked bar
- Combination
- Area
- Stacked area
- Radar
- Filled radar
- Bubble
- XY
- Tree Map
Dynamically set color. You can now bind color values to cells in the spreadsheet to dynamically control colors of component elements. For all component elements, the “Color” selector dialog box includes a new Bind to a Color option. This option allows you to select a cell in the spreadsheet as the color value. The color for that element will reflect the value in the selected cell. The cell could then be linked to another component or external data source to dynamically set the color value at run-time. When a color is bound to the spreadsheet, the Color Selector icon on the Color tab is replaced by a new Bind icon.

The following color formats are supported:
- Hexadecimal (For example, FFFFFF, #FFFFFF, 0xFFFFFF (not case sensitive))
- RGB (For example, (255,255,255))
- VGA color names (For example, aqua, blue, black, fuchsia, and so on (not case sensitive))
- Decimal color equivalent (For example, FF00FF becomes 16711935)
If the specified cell is blank or contains an invalid value, the element color is set to black.
 Load default scenario. The Local Scenario button component now allows users to create and load a default scenario. The new default scenario option allows users to set the model to a specific state when the SWF loads. When designers include the Local Scenario button component in models, at runtime, users can click the button to define and save a scenario. They can then click the Set Default option to load that scenario by default. The next time the model is opened, it automatically loads the specified scenario.
Note: Default scenarios are valid only for the local scenarios on the computer where they are defined (that is, the local computer).
Gauges support multiple indicators. Designers can now configure gauges to display multiple indicators, as well as set the indicator type to be a needle, outside marker, or inside marker.

When designers bind a gauge to multiple spreadsheet cells, the gauge displays an indicator for each cell. The designer can then configure the indicator type, label, and label position for each indicator. Note: When a gauge has multiple indicators, it is an output component only. The Enable Interaction option is not available on Behavior > Common tab, and users cannot manipulate the gauge values at runtime.
Forecasting. The Trend Analyzer component can now be configured to forecast data for a specific time period based on the trend found in existing data. Designers can bind the Trend Analyser component to a range that includes the historical data plus empty cells for the forecast data. At runtime, the Trend Analyzer inserts the trend data and forecast data into the specified cells.

Designers can also specify the number of forecast periods the Trend Analyzer will forecast. To set the number of forecast periods dynamically, designers can bind the Number of Forecast Periods box to a spreadsheet cell and, then bind a dial to the same cell. At runtime, users can manipulate the dial to set the number of forecast periods.
Selectors allow multiple insertions. Many selectors can now be configured to insert multiple chunks of data from different sources into multiple destinations at once.
On the selector “Properties” panel, in the General view, a new Data Insertion list box is available. By default, the list box contains one insertion behavior. Designers can click the Plus icon to add more insertion behaviors. The designer then selects each insertion behavior and specifies its Name, Insertion Type, Source Data, and Destination. At runtime, when users use the selector, the source data values for all the defined insertion behaviors are written to their specified destinations.,
The following selectors do not support multiple insertions: Play Selector, Toggle Button, Push Button, Icon, or Accordion Menu components.
Comments
31 responses to “What’s New in SAP BusinessObjects Xcelsius 2008 SP3?”
Good job, I fully agree, Xcelsius is a fantastic tool for me, I start using it since Xcelsius 3.0, I’m discovering the new version the 2008 SP3, and I like it.
Unfortunately, the trial version ended, and I can’t use it anymore :(…..
Can someone tell me if there is any campaign to obtain a free activation code from SAP?
fouad_zouak@yahoo.fr
Hi,
I am using Xcelsius 2008 SP3 FP1 to develop my dashboard. It has arounnd 300 components in it. i am using local scenario button and set default option. the set default option and loading the scenario is not working as excepted. Set Default option is not giving me what ever i have saved at the time of load. Can any one help me to resolve this issue?
Thanks
Ann
For all Xcelsius questions, please consult the official forum: http://forums.sdn.sap.com/forum.jspa?forumID=302&start=0
El SP3 es bastante estable e integra mucha funcionalidad !… Aún hacen falta cosas como un componente gráfico escalonado, mas propiedades de apariencia como personalización de bordes para las series (columnas, lineas, etc), propiedad de transparencia para los componentes de series por separado como las lineas y los marcadores etc etc…
I’ve a question…. Can we shift the axes in chart components so that the values start from any arbitrary number and not zero? Note: It may seem possible for +ve values if we specify min, max ranges but I’m looking for -ve values too.
Sorry, not sure — in general, these forums are the best place to go:
Official SAP Forum
BOB User Group Forum
I am trying to insert an empty value into combo box Lov’s
Any suggestions?
is it possible to give 2 destinations for a toggle button component while inserting in SP1 2008
Is it possible for the range slider to handle other componants as well?
Can I in some way pick up the current status in the slider for other componants to show the same time range?
Andreas — yes, for example, you can connect the slider to a cell, then use multiple “source data” components. Note that the official Xcelsius forum is here on SAP’s community network…
@Chetan Sachdev
To answer your question, “Which version of Flex framework the component support ? When I checked it last time it was using flex 2.0.1 is it upgraded to flex 3 or higher ?” Yes, Xcelsius SP3 is FLEX 3 compatible-only per SAP BOBJ Product Development Team.
how i can make in xcelsius tree model in one chart, example line+bar+area??
this possible or not?
Farid, sorry about not replying — yes, you can do it by overlaying multiple charts, with transparency if necessary — and see the xcelsius forum link below for more information
I just realize the new version has taken away vertical (value) Axis Labels number format options for charts. Does that happen to you too?
Dongjie — maybe it just moved? I see it under the appearance/text tab…
Score card, Selecting color at run time and selected series display…… great features
Dear All,
Tried the new version. Much stable. The improvements make me feel that SAP is really keen on listening to our feed backs. see the defence vs education comparison of 30 countries http://ugurcandan.net/cool/?p=177 please feel free to comment.
[…] is a season’s greetings dashboard that shows off some of the latest features of Xcelsius 2008 SP3. Tweet the color you’d like to see in the garland. The dashboard updates every 30 seconds. How […]
Is anybody having trouble adding xml data connections with sp3? It will run my previously existing files just fine, but any new files I create do not pull in the data. Any ideas?
Brian, I had the same problem in both SP2 and SP3 for Excel XML map sources. Changes made “within” Xcelsius didn’t seem to stick. I ended up exporting the data file, making the change in Excel, reimporting, and then resetting up the connection. Then it worked fine…
What a Xmas present…!!
I am in the middle of a major effort to deploy an executive dashboard before year-end and I knew I had a lot of work to do in order to get around the three major issues for me; multi selection, multi series manipulation and all the extra cosmetic work to create printable dashboards (yes Senior mgmt still likes to have their own printouts…) so with the SP3 will be able to enjoy some of my vacation time after all because I can use out of the box functionality and save me tons of development time!!!
Yes, SAP finally responded to customers’ feedback and this definitely a major step on the right direction for Xcelsius.
Looking good! inital testing on our dashboards is not giving much in the way of performance enhancements (are swf’s are between 1.5 and 4mb ) – though the new components should help as we currently have to use stacks of additional check boxes/sliders and labels to get functionality. Stability good so far as well…
Jez — I wanted to make sure people saw your link: http://www.jjbr.ltd.uk/Demo/SampleDashboards.swf <– great stuff!
Which version of Flex framework the component support ? When I checked it last time it was using flex 2.0.1 is it upgraded to flex 3 or higher ?
Same level, I think…
I see lots of great new functionality. The new SWF loader component looks realy interesting for integrating multiple dashboards within one single dashboard.
I’ll do some testing with the chart range slider for multitouch software since I’m working on a multitouch SAP BO Xcelsius project. This is a great component for multi touch usage. The Xcelsius GUI fits perfectly in the NUI principle (natural user interface). I’m glad to see that Xcelsius is being developed constantly and new functionality is added every now and then.
Great software and a great blog! I’ll keep following you on Twitter Timo!
The advancements promised by this service pack are certainly something to get excited about. It looks like SAP has really listened to product feedback. I’m excited by the inclusion of visual design concepts from Tufte and Few and in a number of the enhancements to graphs. I also see the push button as a great timesaver from those developing whatif scenario analysis visualisations.
If it’s stable then my hat goes off to SAP on delivering exactly what we’ve all been wishing for. A great XMAS present.
I had some problems installing it (Microsoft bug, apparently — it was covered in the install documentation), but so far, it’s been very stable, and some previous issues seem to have disappeared (for some reason, Excel is very slow to load on my PC, and this occasionally created problems)
Will xcelsius SP3 work work for xcelsius 2008 present?
[…] on Dec.15, 2009 Just in time for Christmas, Xcelsius 2008 SP3 arrived this week. Timo Elliot has an excellent summary of its new features and Ryan Goodman lists his favorite top 10 enhancements. Service Pack 3 is intended to keep […]
This is fantastic news! I’m going to be able to remove so many inefficient components from my models because I don’t have to code this stuff manually anymore! If this is anywhere near as complete as advertised, developers will really start saving some time and adding some real value.