Tag: Fun
-
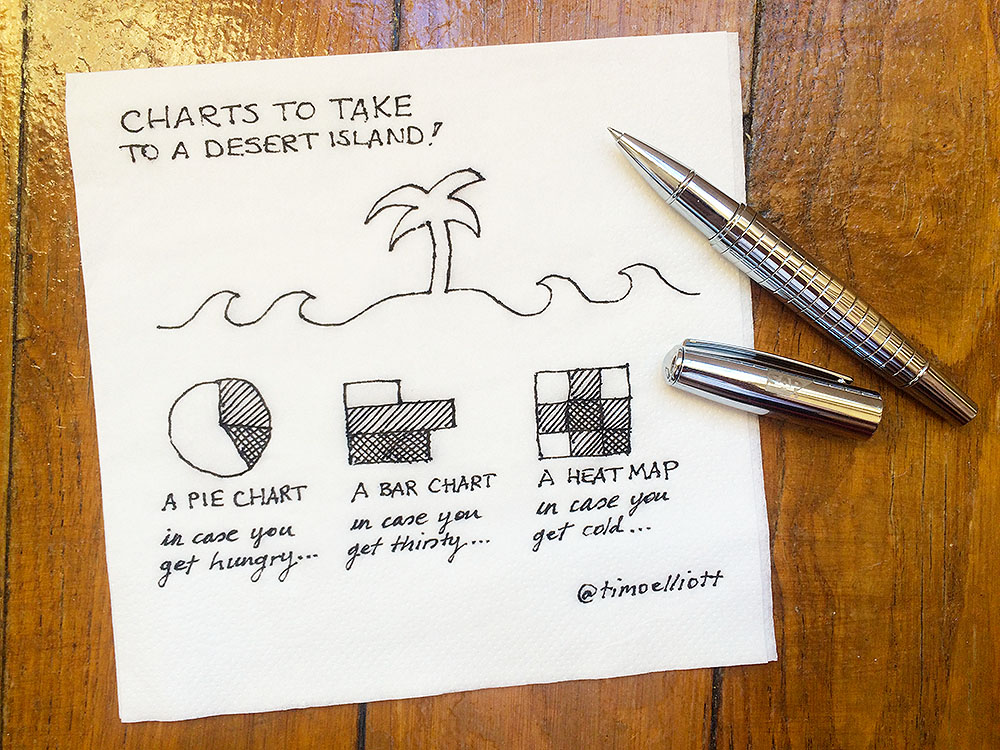
Charts To Take To A Desert Island?
Charts to take to a desert island
-
The Big Data Playlist!
A top ten Big Data music playlist!
-
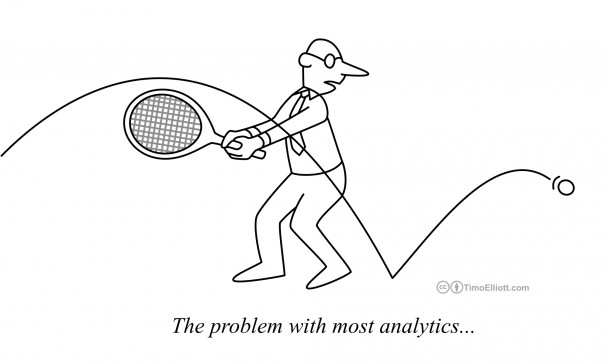
Cartoon: The Problem With Most Analytics
Cartoon: the problem with most analytics projects is that they just don’t react fast enough.
-
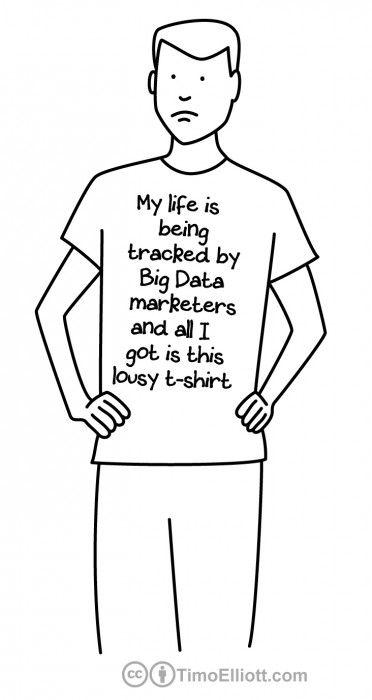
Cartoon: Big Data Marketing
Most people don’t realize how much of their online activity is being tracked by big data marketers.
-

Cartoon: Developing IT Agility
Cartoon: bouncing around some ideas about analytics agility…
-
Cartoon: Data Scientists Are The New IT Rock Stars
Data Scientists are the new rockstars say all the articles. But they’re hard to find an expensive, so consider using data science services instead…
-

Cartoon: The Perils of Business Innovation
Innovation? no, we already tried that.
-
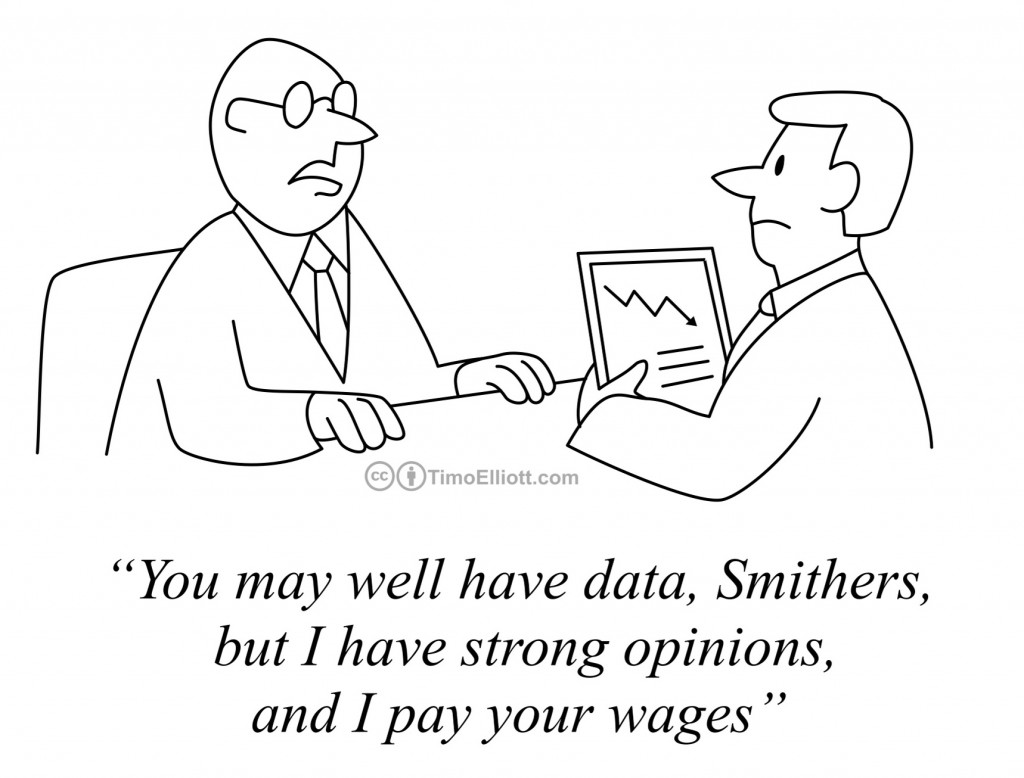
Cartoon: What Chance Does Data Have?
What chance does data have when faced with strong opinions?! Some tips…
-
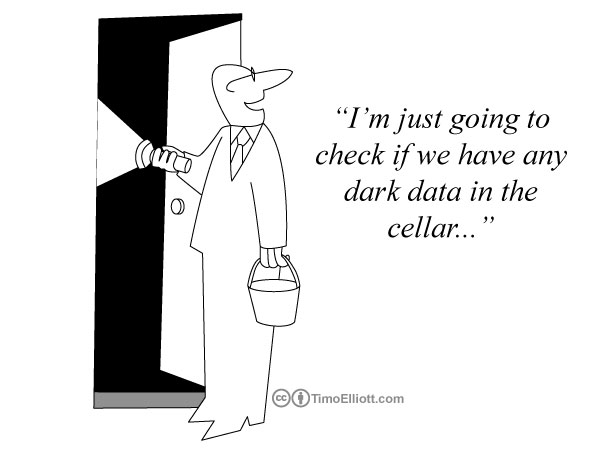
Are You Making The Most of Your Dark Data?
Do you have any ‘dark data’ in your cellar? Here are some places to look…
-

Analytics Cartoon Caption Contest
Results of the first Analytics Cartoon Caption Contest