
There are lots of mobile applications available that allow skiers and snowboarders to keep track of their exploits on the slopes, including RealSki, SkiTracks, and GPS Kit.
But I wanted to have full control over analyzing the data, so I instead opted for a general-purpose application called Sensor Data from Wavefront Labs. As the name implies, the app can record ALL of the information available from the iPhone’s five different sensors — and then export it as an easy-to-read data file.


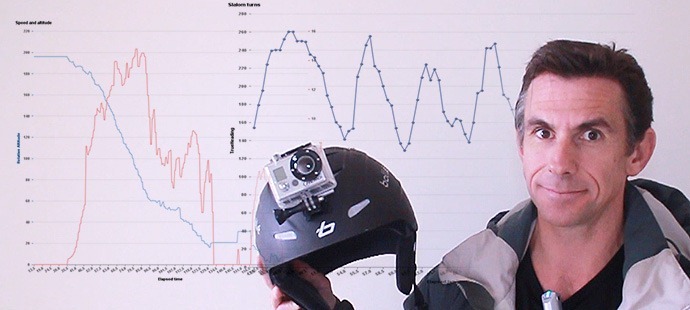
Here’s an example of one of the runs – I pressed the “start capture” button at the top of the lift, choosing the option to record a line of data every 1/2 second. At the end of the day, I exported the file from my iPhone to my PC, and opened it up in the SAP Visual Intelligence data discovery tool.

From there, I was able to quickly and easily create a series of graphs and charts showing different aspects of the run:

The fun part was synchronizing the analysis with video I took with a helmet-mounted GoPro camera – watch the video below to see more about the process, and what happened during the highlighted area in the chart!

If you were intrigued, you should take SAP Visual Intelligence for a spin with the free trial offer, or the new $99 personal version that gives access to text and Excel files.
Comments
One response to “Ski Analytics With SAP Visual Intelligence”
I am designing an MBA innovation course here at the UofU that applies the IoT to skiing. I came across your demo on the web and wanted to know if you would be interested in collaborating with me on designing the lab that would do the data analytics here.
Chris